Global Journal of Allergy
Green synthesis and characterization of silver nanoparticles using Cassia fistula and assessment of its in vitro anti diabetic activity
J Bagyalakshmi1*, S Siva Sivakumaran2, K Priya2 and R Swathika2
2M. Pharm, Department of Pharmaceutics, Sri Ramakrishna Institute of Paramedical Sciences, College of Pharmacy, Tamil Nadu, Coimbatore-44, India
Cite this as
Bagyalakshmi J, Sivakumaran SS, Priya K, Swathika R (2023) Green synthesis and characterization of silver nanoparticles using Cassia fistula and assessment of its in vitro anti diabetic activity. Glob J Allergy 9(1): 001-011. DOI: 10.17352/2455-8141.000026Copyright License
© 2023 Bagyalakshmi J, et al. This is an open-access article distributed under the terms of the Creative Commons Attribution License, which permits unrestricted use, distribution, and reproduction in any medium, provided the original author and source are credited.The study aimed to synthesize silver nanoparticles with anti-diabetic properties using Cassia fistula bark extract using a one-step biological method. The methanolic bark extract was mixed with a 1mm silver nitrate solution, and the resulting silver nanoparticles were characterized using various methods such as visual examination, UV visible spectroscopy, FTIR spectroscopy, Field Emission Scanning Electron Microscopy, in vitro Dissolution Study, Particle Size determination, and Zeta Potential determination.
The green synthesis of silver nanoparticles using Cassia fistula bark extract aimed to develop a novel drug delivery system with herbal drugs to reduce side effects. The plasmon band in the silver nanoparticles was found to be 425 nm, and the FTIR study revealed a higher presence of Hydroxyl and carboxylic groups as reducing and stabilizing agents.
The drug entrapment was found to be 61.5%, the particle size was 148.5 nm and the polydispersity index was 0.243. The zeta potential was measured to be -0.1 mV, indicating no stabilization of the silver nanoparticles. The FESEM analysis showed the synthesized silver nanoparticles to be spherical and oval in shape. This biological method is eco-friendly and cost-effective, making it a promising alternative to traditional chemical/stabilizing agents.
Introduction
Pharmaceutical nanoparticles are defined as solid, submicron-sized (less than 1000 nm in diameter) drug carriers that may or may not be biodegradable. The term nanoparticle is a combined name for both nanospheres and nanocapsules.
The field of nanotechnology is one of the most active areas of research in modern material sciences. Nanotechnology is a field that is developing day by day, making an impact in all spheres of human life and creating a growing sense of excitement in the life sciences, especially biomedical devices and biotechnology. The term “nanoparticles” is used to describe a particle with a size in the range of 1 nm - 1000 nm [1,2].
Silver nanoparticles are one of the promising products in the nanotechnology industry. The development of consistent processes for the synthesis of silver nanomaterials is an important aspect of current nanotechnology research. One such promising process is green synthesis. Silver nanoparticles can be synthesized by several physical, chemical, and biological methods. However, for the past few years, various rapid chemical methods have been replaced by green synthesis because of avoiding toxicity of the process and increased quality.
Green synthesis, also called biogenic synthesis, is considered an alternative approach for synthesizing the AgNPs. The process of synthesis starts after incubation of the plant extracts with silver salts (silver nitrate is mostly used). The biological synthesis of nanoparticles depends on three factors, including (a) the solvent; (b) the reducing agent; and (c) the non-toxic material. The major advantage of biological methods is the availability of amino acids, proteins, or secondary metabolites present in the synthesis process, the elimination of the extra step required for the prevention of particle aggregation, and the use of biological molecules for the synthesis of AgNPs is eco-friendly and pollution-free. Biological methods seem to provide controlled particle size and shape, which is an important factor for various biomedical applications [2].
The advantages of herbal medicines in the treatment of diabetes include cheaper cost of medicines, widely available and less toxic, and fewer side effects as compared to allopathic drugs. All in all, diabetes can be prevented with herbal medicines and herbs are efficient and safe for one’s health. The hypoglycemic effect of some herbal extracts has been confirmed in human and animal models of type 2 diabetes. The World Health Organization Expert Committee on Diabetes has recommended that traditional medicinal herbs be further investigated. Although several therapies are in use for treatment, there are certain limitations in allopathic drugs. A major hindrance in the amalgamation of herbal medicine in modern medical practices is the lack of scientific and clinical data proving their efficacy and safety. There is a need for conducting clinical research in herbal drugs, developing simple bioassays for biological standardization, pharmacological and toxicological evaluation, and developing various animal models for toxicity and safety evaluation [3-5].
Cassia fistula Linn. also known as golden shower, Indian laburnum, belongs to the family Leguminoceae. In traditional medicine, it is used in the treatment of hematemesis, pruritus, intestinal disorders, leukoderma, and diabetes and as an antipyretic, analgesic & laxative [6,7].
In this study, we synthesized silver nanoparticles using bark extract of Cassia fistula, and its characterization was done along with its in vitro anti-diabetic study.
Materials and equipment
Materials
Cassia fistula bark powder
Chemical Reagents
Silver nitrate (AgNO3), Distilled water.
Equipment Required
- Magnetic stirrer with hot plate,
- Magnetic bead, centrifuge (REMI),
- Shimadzu UV-visible spectrophotometer,
- FTIR spectrophotometer,
- Malvern Zeta size analyzer,
- Field emission scanning electron microscopy.
Procedure
Sample collection and authentication: The plant specimen of Cassia fistula was collected from Siruvani, Coimbatore, and its identity was ascertained and authenticated by botanists of the Botanical Survey of India, Southern Regional Centre, Coimbatore.
Drying and pulverizing: The bark of Cassia fistula was purchased from the local market and mud was removed and cleaned under tap water shad dried material was cut into fine pieces and powdered by the mechanical grinder, passed through sieve number 16 and the powder was stored in an air-tight container until used.
Preparation of methanolic extract of Cassia fistula: Methanol extract of Cassia fistula was prepared by cold maceration method. The powdered bark (60 g) of Cassia fistula was macerated in 600 ml of methanol for 24 hours at room temperature. Then macerated methanolic extract was filtered with muslin cloth [8]. The filtrate was evaporated to dryness at a temperature not exceeding 40 0C for 1 hour in a hot air oven.
Phytochemical screening
Preparation of test solution: The filtered methanolic extract of Cassia fistula (powder) was used as a test solution for preliminary screening of phytochemical constituents.
Preparation of stock solution: 1 mg of methanolic extract was weighed and diluted to 10 ml with distilled water.
Preparation of 1mM silver nitrate aqueous solution: 0.017 g of silver nitrate was dissolved in 100 ml of distilled water and stored in an amber-colored bottle until further use [10].
Synthesis of Cassia fistula silver nanoparticles: 5 ml of Cassia fistula methanolic extract was taken in a beaker and placed on a magnetic stirrer with a hot plate. To this 50 ml of 1Mm silver nitrate solution was added dropwise with constant stirring at 120 rpm. The color change of the solution was checked periodically [10].
Separation of silver nanoparticles: The synthesized Cassia fistula silver nanoparticles were separated by centrifugation using REMI centrifuge at 5000 rpm for 15 minutes. The supernatant liquid was discarded [10]. The pellets present in the liquid were dried in a hot air oven for 30 minutes at 50 oC - 70 oC and the pellets were collected and stored.
Preformulation study
Solubility test: Cassia fistula bark extract powder of about 1mg was taken in a test tube and solubility in ethanol, water, methanol, chloroform, and diethyl ether was checked.
UV- VIS spectral analysis of Cassia fistula bark: 0.5 ml of Cassia fistula bark extract was taken in a 10 ml standard flask and diluted with distilled water. Then UV- UV-visible spectra were taken in the range of 200 nm - 400 nm using phosphate buffer at pH 7.4 as blank [11].
Preparation of calibration curve of Cassia fistula bark extract using UV- visible absorption spectroscopy using phosphate buffer at pH 7.4: From the standard stock solution of Cassia fistula 0.2, 0.4, 0.6, 0.8,1.0, 1.2 ml were withdrawn to 10 ml volumetric flask and then made-up volume with phosphate buffer pH 7.4 to get a concentration range of 2-12 μg/mL. The absorbance of these solutions was measured at 277 nm using a JASCO V-530 UV 1600 UV- visible spectrophotometer. Phosphate buffer pH 7.4 was used as blank. The calibration curve was plotted between concentration and absorbance [12].
FTIR spectroscopy of Cassia fistula bark, silver nitrate: The FT-IR spectrum of the drug was recorded using an FT-IR Spectrophotometer (Shimadzu JASCO 4100). The diffuse reflectance technique was utilized in the mid-IR 4000 - 400 cm-1 spectral region. The procedure consists of dispersing the sample in KBr (100 mg) using a mortar and triturating the materials into a fine powder bed into the holder using a compression gauge. The pressure was around 5 tons for 5 minutes. The pellet was placed in the light path and the spectrum was recorded. The characteristic peaks of the functional groups were interpreted [13].
Characterization of synthesized Cassia fistula silver nanoparticles
Color change: The confirmation of the synthesized Cassia fistula silver nanoparticles is done on a visual basis. The color change of Cassia fistula extract and silver nitrate solution with respect to time was observed [11].
Fourier transform infrared spectroscopy: IR spectra of the sample were recorded on Shimadzu JASCO FT/IR 4100. Approximately 0.1 to 1.0 % Cassia fistula silver nanoparticles are well mixed into 200 to 250 mg fine alkali halide KBr powder and finely pulverized and put into a pellet-forming die. A force of approximately 8 tons is applied for 4 - 5 minutes to form transparent pellets. The spectrum measurements were recorded by placing pellets in a light path holder. The characteristic peaks of the functional groups were interpreted.
The FTIR spectrum of Cassia fistula silver nanoparticles were recorded [13].
Drug entrapment: The entrapment efficiency of Cassia fistula silver nanoparticles was determined by adding 10 ml of phosphate buffer of pH 7.4 and sonicated in a bath sonicator and filtering. 1 ml of filtrate is made up to 10 ml with phosphate buffer and was assayed spectrophotometrically at 277 nm (UV visible spectrophotometer, model UV-1601 PC, Shimadzu). The amount of entrapped drug was calculated from the equation % drug entrapment = (W-w)/W×100(14).
Determination of particle size: The average mean diameter and size distribution of Cassia fistula silver nanoparticles is found by the Dynamic Light Scattering method using Malvern zetasizer at 25 °C. The dried silver nanoparticles were dispersed in water to obtain proper light scattering intensity for Cassia fistula silver nanoparticles [14].
Determination of zeta potential: Zeta potential is a measure of surface charge. The surface charge (electrophoretic mobility) of Cassia fistula silver nanoparticles can be determined by using a Zeta sizer (Malvern Instrument) having zeta cells, polycarbonate cells with gold-plated electrodes, and using water as a medium for sample preparation. It is essential for the characterization of the stability of the Cassia fistula silver nanoparticles [14].
Field emission scanning electron microscopy: FESEM analysis of Cassia fistula silver nanoparticles was performed to evaluate the surface morphology of nanoparticles. Silver nanoparticles were prepared and dried well to remove the moisture content and images were taken by using Zeiss Sigma, G.
In-vitro anti-diabetic study
Seven concentrations of plant extract were prepared by dissolving in double distilled water. These were 10 mg/ml, 20 mg/ml, 40 mg/ml, 80 mg/ml, 160 mg/ml, 320 mg/ml, 640 mg/ml. A total of 500 µl of plant extract and 500 µl of 0.02 M sodium phosphate buffer (pH 6.9 with 0.006 M sodium chloride) containing α-amylase solution (0.5 mg/ml) were incubated for 10 minutes at 25°C. After pre-incubation,500 µl of 1% starch solution in 0.02 M sodium phosphate buffer (pH 6.9 with 0.006 M sodium chloride) was added to each tube at 5s intervals. This reaction mixture was then incubated for 10 minutes at 25 °C. 1 ml of color reagent was added to stop the reaction. These test tubes were then incubated in a boiling water bath for 5 minutes and cooled to room temperature. Finally, this reaction mixture was again diluted by adding 10 ml distilled water following which absorbance was measured at 540 nm [15].
Positive control
Here, the positive control used is an anti-diabetic drug Acarbose [16].
In-vitro drug release study
Drug release was determined by dialysis method; two ml of Cassia fistula silver nanoparticles formulation was poured into dialysis bags and put into a 25 ml phosphate buffer (pH 7.4) and stirred (100 rpm, room temperature). At predetermined time intervals, 2 ml of phosphate buffer was taken and then substituted with fresh phosphate buffer. Finally, the amounts released in the phosphate buffer were measured by a spectrophotometer at 277 nm. Aliquots withdrawn were assayed at each time interval for the drug released at λ max of 277 nm using a UV-visible spectrophotometer by keeping phosphate buffer pH 7.4 blank and the amount of released drug was estimated by the standard curve [17].
In vitro drug release kinetics
The drug release kinetics of Cassia fistula silver nanoparticles were determined by plotting the following kinetic models, using the data collected from in vitro release studies (zero order, first order, and Higuchi equations). The mechanism of drug release was determined by using the Korsmeyer-Peppas equation [18].
Zero-order kinetics: The zero-order rate (Eq. 1) describes the systems where the drug release rate is independent of its concentration.
C = K0t (1)
Where K0 is the zero-order rate constant expressed in units of concentration/time and t is the time.
A plot of the amount of drug released versus time will be linear for zero-order kinetics. The dosage forms following this profile, release the same amount of drug by unit time and it is the ideal method of drug release in order to achieve a prolonged pharmacological action.
First-order kinetics: First-order kinetics was first applied for drug dissolution studies. The first-order equation (Eq 2 & 3) describes the release of a drug from a system where the release rate is concentration-dependent.
Log Ct = Log Co + K1t / 2.303 (2)
Log Co - Log Ct = Kt / 2.303 (3)
Where Ct is the amount of drug released in time t, CO is the initial concentration of the drug, k1 is the first order constant, and t is the time. Here the graphical representation of the log cumulative of % drug remaining versus time will be linear with a negative slope. The dosage form follows this profile in the amount of drug released by unit time diminishes.
Higuchi’s model: Higuchi equation (Eq 4) describes drug release as a diffusion process based on Fick’s law, square root time dependent. For diffusion-controlled processes a plot of Q versus square root of time is linear.
Q = KHt1/2 (4)
Where
Q is the amount of drug released in time t per unit area, KH is the Higuchi dissolution constant and t is the time in hours.
Korsmeyer- peppas equations: Korsmeyer- Peppas equation (Eq 5) to analyze both Fickian and non-Fickian release of drugs.
The logarithm form of equation (Eq 6) could be written as:
Where Mt/M∞ is the fraction of drug released at time t, n is the diffusion exponent indicative of the mechanism of transport of the drug, and K is the kinetic constant (having units of t) incorporating structural and geometric characteristics of the delivery system.
Result and discussion
Preformulation study
6(1) Solubility test: The powdered bark of Cassia fistula has undergone the solubility test. This test was carried out in different solvents such as Ethanol, Water, Methanol, Diethyl ether, and Chloroform, the results are shown below in Table 1.
The solubility test which comes under the Preformulation study which has been performed for the extract of Cassia fistula bark has been soluble in Methanol, Ethanol, and water and sparingly soluble in Diethyl ether, Chloroform, so its highly soluble in polar solvents and sparingly soluble in non-polar solvents.
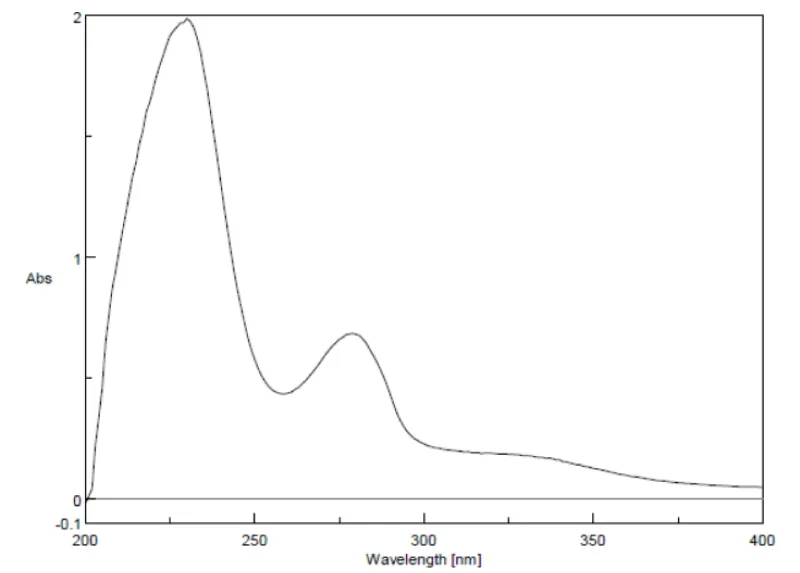
UV- visible spectral analysis of Cassia fistula bark: Then UV-visible absorption spectra for the sample were taken in the range of 200-800 nm. The bark of Cassia fistula 0.05 mg was taken in a 10 ml standard flask and diluted with distilled water. The absorption peak obtained is shown in Figure 1. The maximum absorption Cassia fistula bark extract was found at 277 nm and hence selected as the wavelength f for further studies.
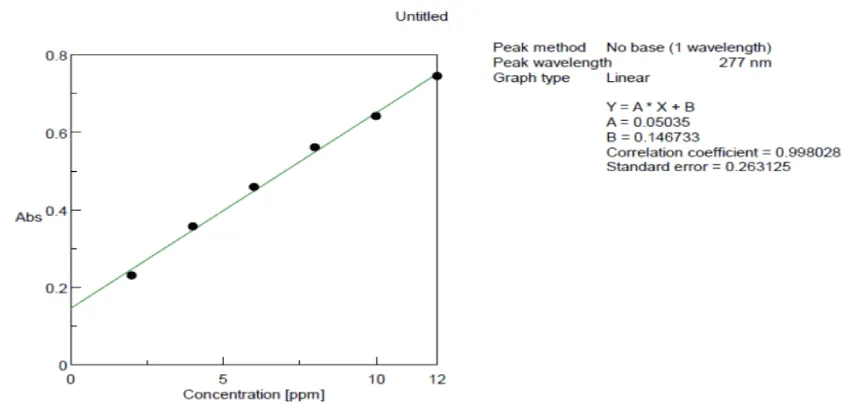
Preparation of calibration curve for Cassia fistula bark extract using UV-visible absorption spectroscopy at 277 nm: In the Calibration curve, the linearity was obtained between 2 - 12 µg/ml, and the regression value was found to be R2 = 0.998. Hence the sample Cassia fistula bark methanolic extract at the concentration between 2 – 12 µg/ml obeys Beer Lambert’s law. The graph between Concentration versus Absorbance values is given in Table 2.
In the standard curve concentration vs absorbance was plotted and given in Figure 2.
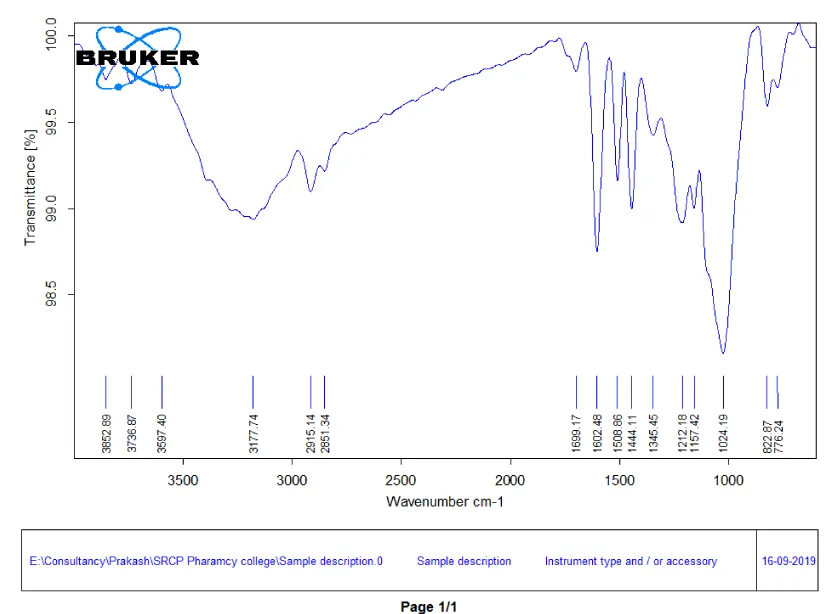
FTIR spectroscopy of Cassia fistula bark: The FTIR spectrum of Cassia fistula bark has an absorption peak of 3736.87 which indicates OH stretching due to the presence of alcohol.
The Peak at 3597.40 indicates the presence of N-H Amide or Amine.
The Peak at 1699.17 indicates the presence of C = O Amide stretching.
The C-H bending stretching compounds indicate the presence at 822.87.
Finally, the absorption peaks at 1345.45 indicates the presence of alkanes, 776.24 indicates the presence of alkenes, 776.24 indicates the presence of aromatic rings [13].
The FTIR Spectra of Cassia fistula bark is given in Figure 3.
The FTIR wavenumbers of sample and standard wave numbers range along with interpretation is given in Table 3.
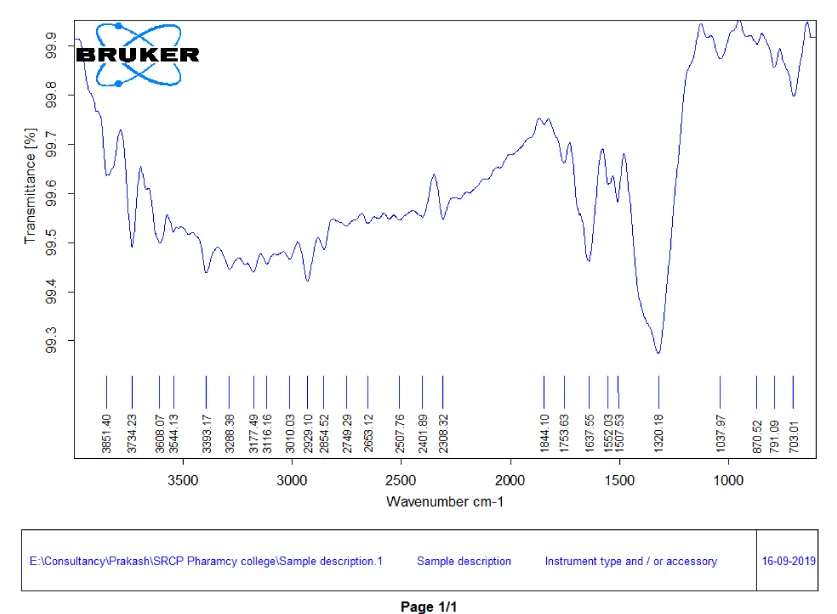
FTIR spectroscopy of silver nitrate: The FTIR spectrum of silver nitrate has absorption peaks at 3648.66, 3446.17 has denoted the presence of OH groups due to the presence of alcohols and phenols. The strong absorption peak at 1844.10 has denoted the presence of N - O (nitro compounds). The peak at 1637.55 denotes the presence of Amide C = O. The FTIR spectra of silver nitrate are given in Figure 4. The FTIR wavenumbers [19,20] of the sample and standard wave number range along with interpretation are given in Table 4.
Green synthesis of silver nanoparticles
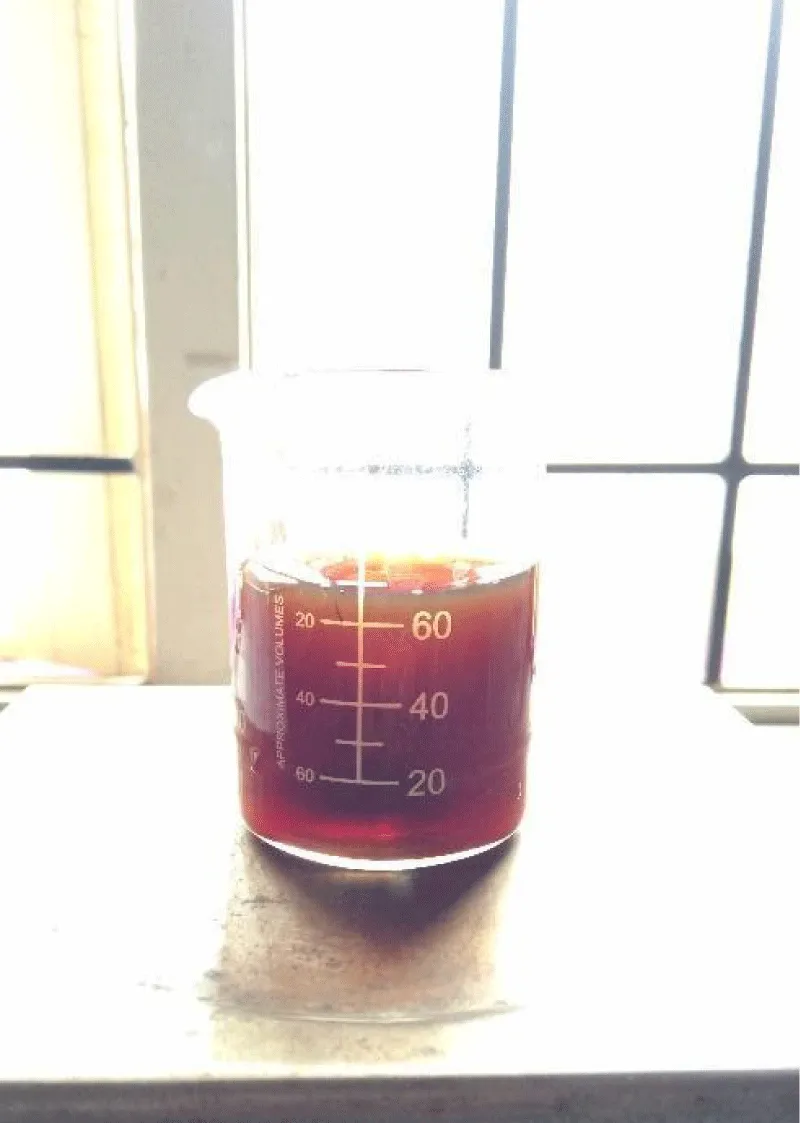
The preparation of Cassia fistula silver nanoparticles is done by drop-wise addition of silver nitrate solution to the bark extract which was placed on the magnetic stirrer with a hot plate at 120 rpm. The formation of silver nanoparticles is denoted by the color change from yellow to brown color.
Characterization of silver nanoparticles using Cassia fistula
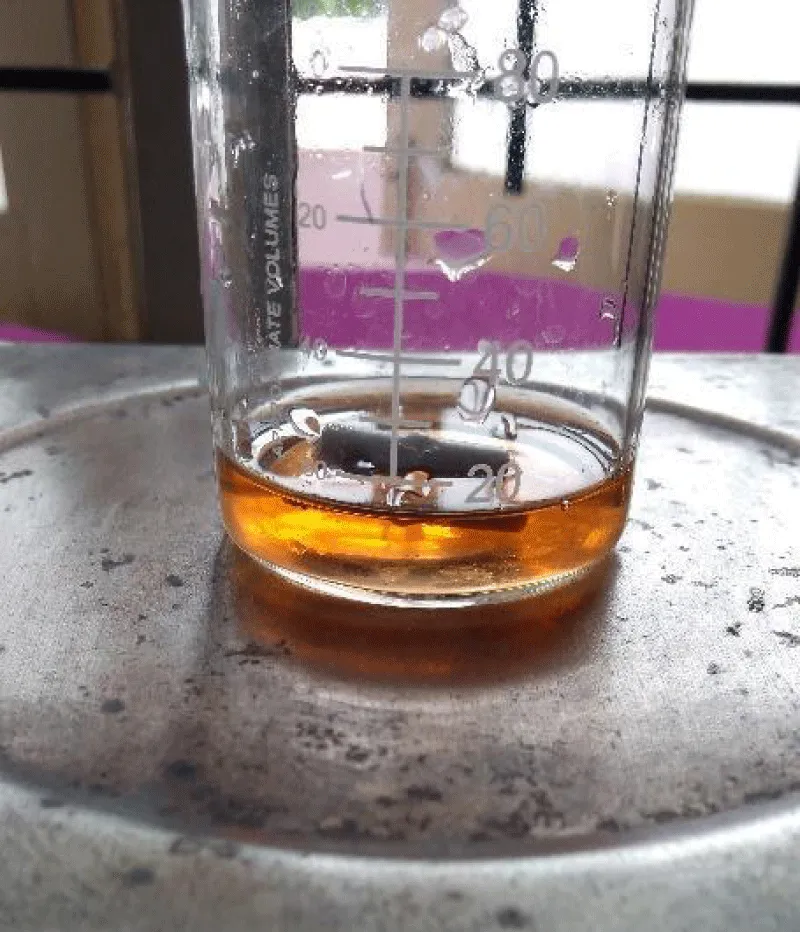
Visual examination: The color of Cassia fistula extract in the initial stage was yellow, after the addition of silver nitrate solution it turned into a dark brown color. After 90 minutes there is no colour change which denotes the completion of the reaction [11].
The image of Cassia fistula extract is depicted in Figure: 5. The image of Cassia fistula silver nanoparticles is depicted in Figure 6, which denotes the formation of silver nanoparticles after 90 minutes.
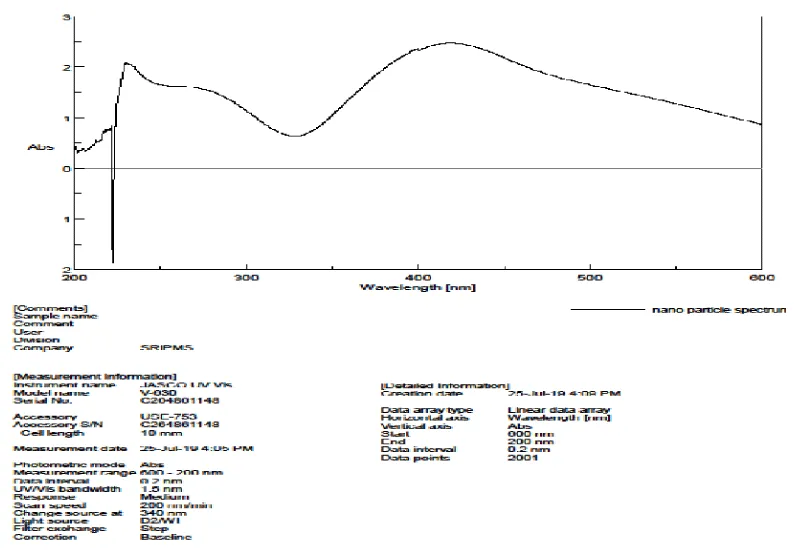
UV- visible spectroscopy: The formation of Cassia fistula silver nanoparticles and its completion was characterized by using UV-visible spectral analysis. The presence of the formed silver ions was monitored and the reduction of Ag+ ions can be seen by measuring the UV-Vis spectrum from the wavelength 400 nm - 800 nm. Distilled water was used as a blank [10]. The Plasmon band in the silver nanoparticles was found to be 425 nm.
The UV Visible Absorption spectra of Cassia fistula silver nanoparticles are depicted in Figure 7.
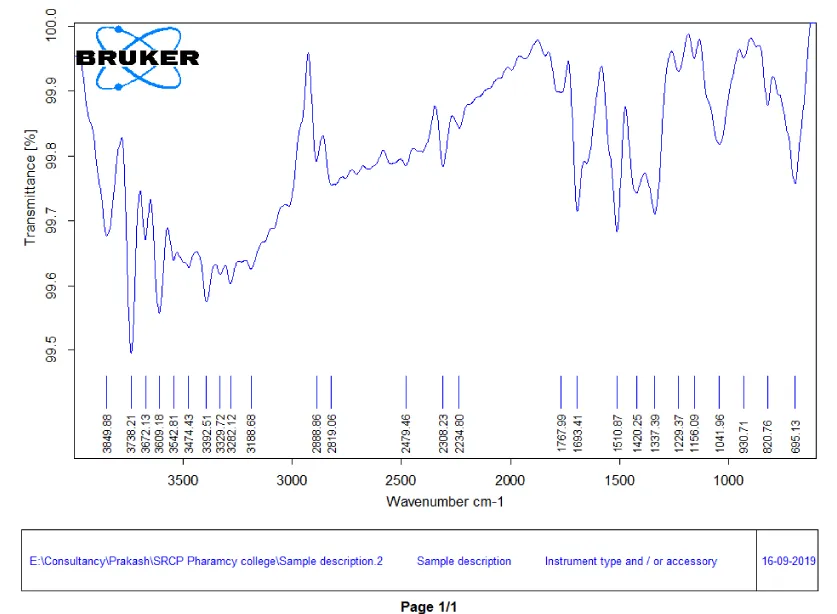
FTIR spectroscopy of Cassia fistula silver nanoparticles: The FTIR spectra of silver nanoparticles have peaks at 3609.1 which denotes OH stretching of free alcohol.
The peak at 3329.72 denotes Alkyne CH stretching,
The peak at 3392.51 denotes Amine or Amide N-H stretching,
The peak at 2888.86 denotes Alkyne sp^3 C-H stretching,
The peak at 3849.88 denotes Carboxylic Acid compounds,
The peak at 2234.80 denotes Nitrile CH Compounds,
The peak at 1767.99 denotes C=O stretching in Carboxylic Acid,
The peak at 1510.87 denotes nitro compounds,
The peak at 1337.39 denotes Alkanes, 820.76 denotes C-H bending and 695.13 denotes Aromatic rings [13].
The FTIR interpretation of Cassia fistula silver nanoparticles are depicted in Table 5 and the FTIR spectra of Cassia fistula silver nanoparticles are depicted in Figure 8.
Drug entrapment: The Drug Entrapment study was examined from the supernatant liquid of Cassia fistula silver nanoparticles by centrifugation. The calibration curve has been plotted between Concentration vs. absorbance at 277 nm. By this standard curve, the amount of drug present in supernatant liquid was obtained.
The amount of drug present in the supernatant liquid was obtained from the standard calibration curve (w). The total amount used in the preparation of nanoparticles (W).
So (W-w) is the amount of drug entrapped. Percentage entrapment is calculated [14] by. % drug entrapment =
- The % entrapment of drug or drug content of Cassia fistula silver nanoparticles was found to be 61.5%.
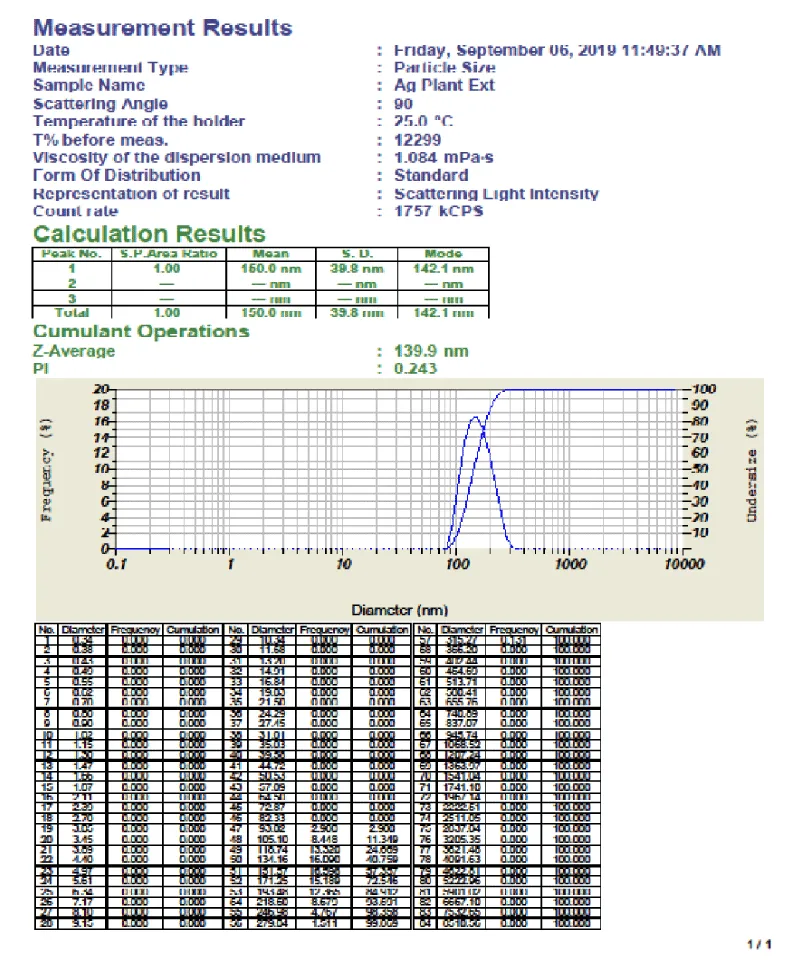
Particle size measurement: An important parameter for the characterization of nanoparticles is Particle Size. The Percentage intensity of particle size distribution of biosynthesized Cassia fistula silver nanoparticles were depicted in Figure 9.
- The average particle size of Cassia fistula was found to be 148.5 nm.
- The Particle size measurement showed the presence of nanoparticles with Polydispersity indices PDI value is 0.243.
- The polydispersity index was calculated by the square of the standard deviation divided by the mean particle diameter.
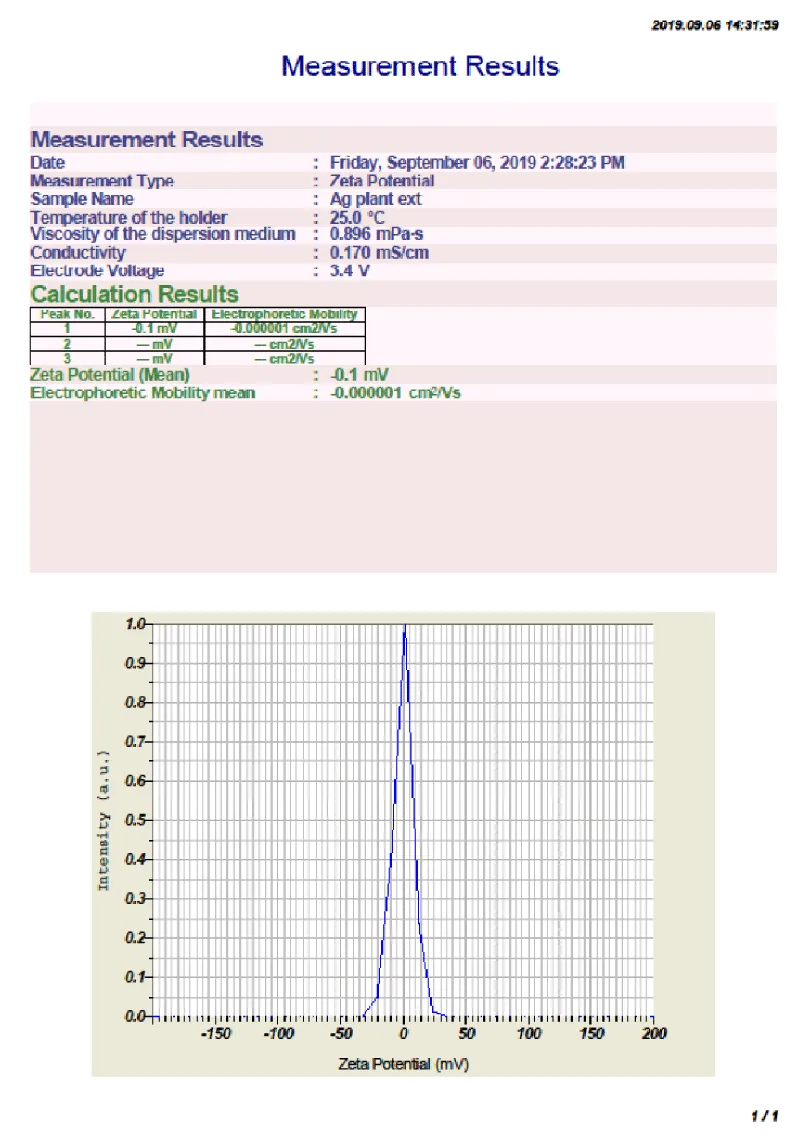
Zeta potential measurement: Zeta potential is an important study for determining the stability of Cassia fistula silver nanoparticles. These values indicate there is no stabilization of nanoparticles. The Zeta potential distribution of Cassia fistula silver nanoparticles was depicted in the Figure 10 for determining the stability of
- For Cassia fistula silver nanoparticles zeta potential measured was found to be -0.1 mV.
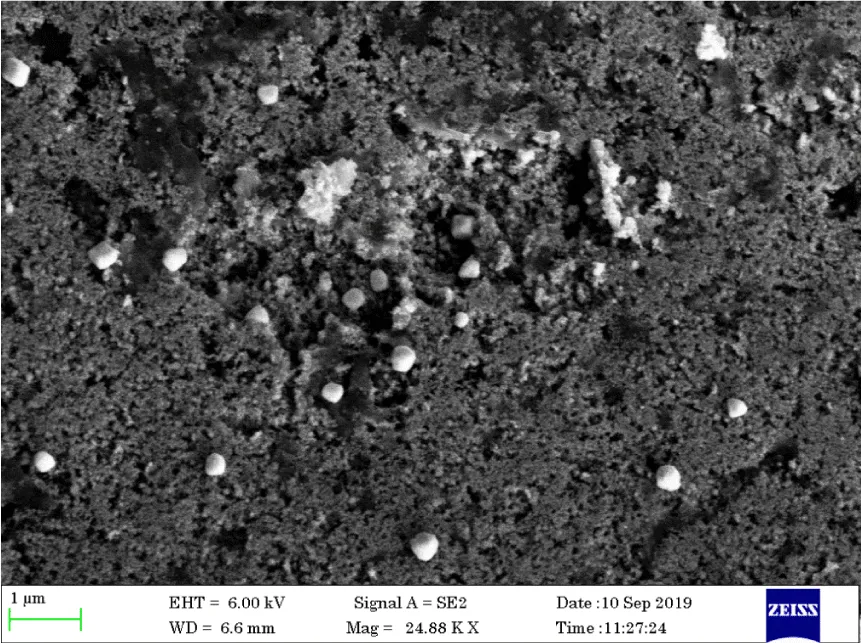
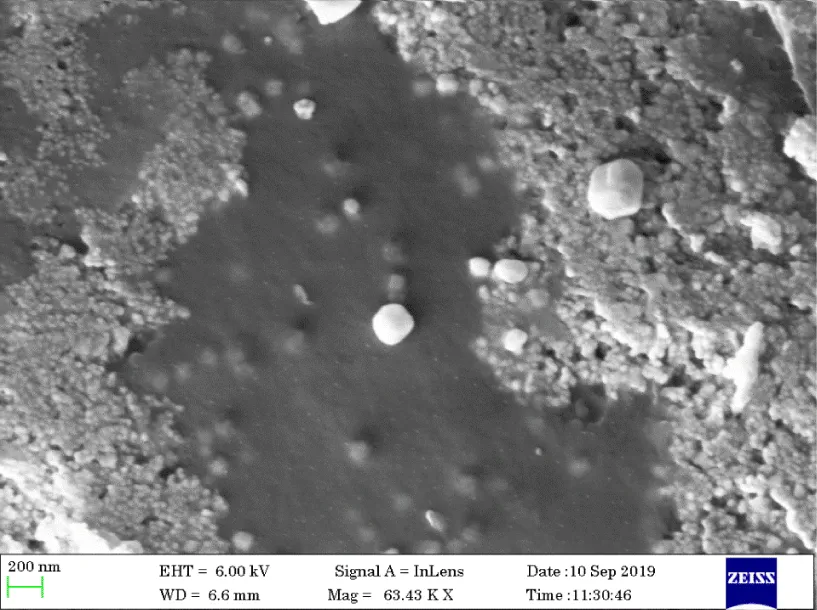
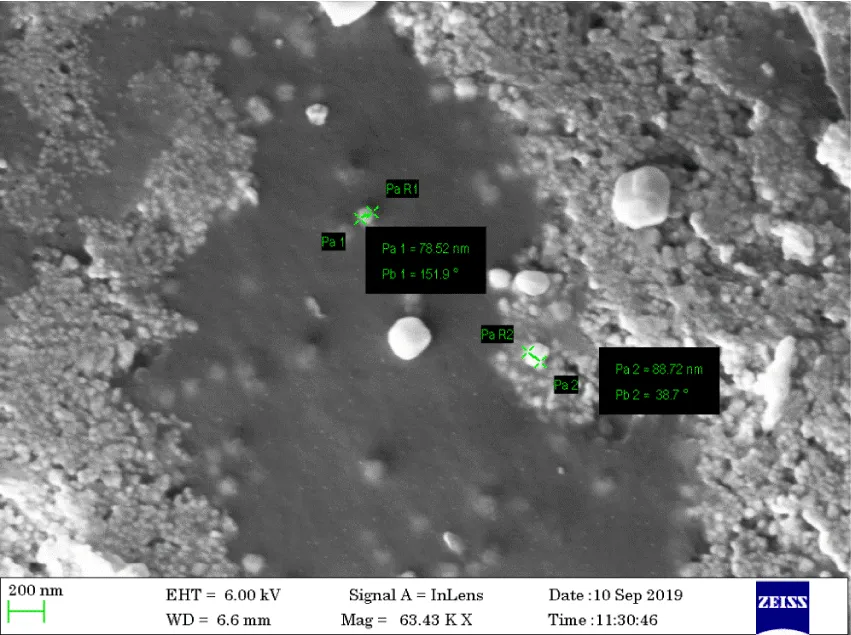
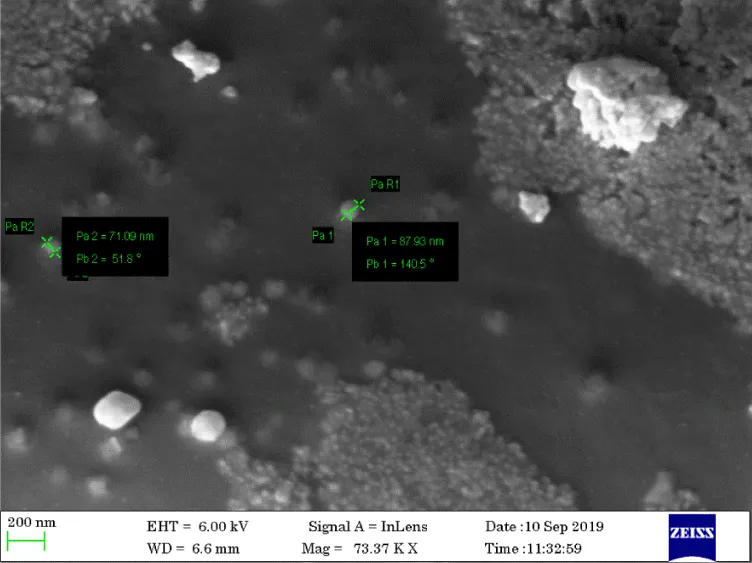
FESEM analysis of Cassia fistula silver nanoparticles: FESEM analysis of Cassia fistula silver nanoparticles were performed to analyze the surface morphology of nanoparticles. The prepared Cassia fistula Silver nanoparticles were dried well to remove the moisture content. The images were taken in 24000 X, 63000 X, and 73000 X are shown in Figures 11-14 respectively.
FESEM clearly shows the presence of the synthesized silver nanoparticles with magnification X 24000, X 63000, 73000 X. Mostly the nanoparticles were spherical, oval in shape, and mostly aggregated, and a few individual particles were also observed [15].
Comparison
In-vitro antidiabetic study of Cassia fistula
α- Amylase inhibition study: Pancreatic α-amylase, an important enzyme of the digestive system hydrolyses starch into a mixture of smaller oligosaccharides comprising of maltose, malt triose, and polyglucans which are further degraded by glucosidase into glucose that enters the bloodstream upon absorption. This leads to elevated postprandial hyperglycemia (PPHG). Hence, it is important to control these two aspects in the treatment of type 2 diabetes.
In the present study, an in vitro alpha-amylase inhibition model was used to screen the Cassia fistula silver nanoparticles to evaluate the hypoglycaemic effects.
The Alpha-amylase inhibitors obstruct the absorption and the digestion of carbohydrates. Acarbose, a synthetic alpha-amylase inhibitor delays the digestion of carbohydrates and inhibits the action of pancreatic amylase in the breakdown of starch, which leads to side effects such as abdominal pain, diarrhea, and soft faeces in the colon [16].
The result denotes that Cassia fistula exhibits good α- amylase inhibition under in vitro conditions.
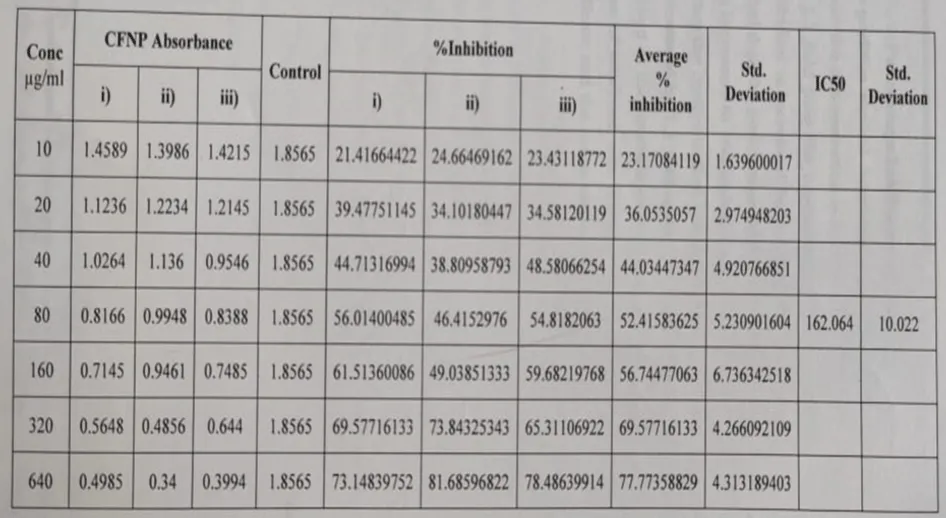
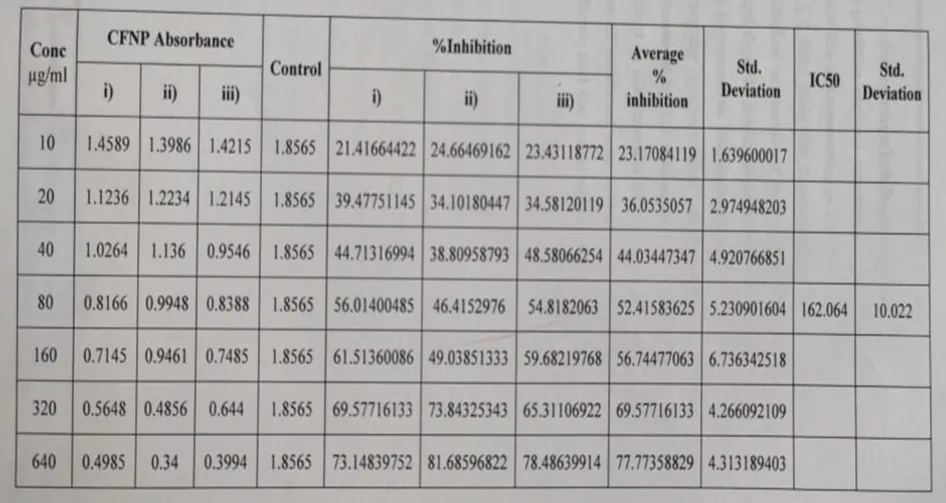
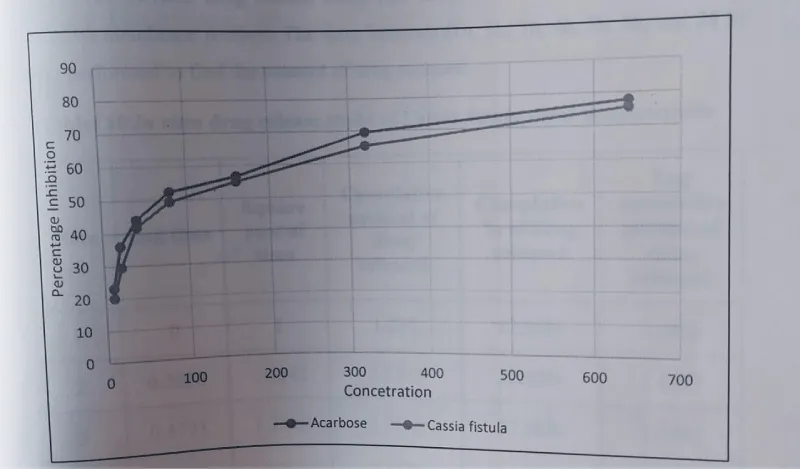
Percentage inhibition of acarbose: The percentage inhibition of α amylase for the positive control Acarbose was found to be 23.17% at a concentration of 10 µg/ml. When the concentration was increased to 20 µg/ml percentage inhibition was increased by 1.2 fold then the concentration was increased to 40 µg/ml so the percentage inhibition was increased by 1.1 fold, further, the concentration was increased to 80 µg/ml then the percentage inhibition is increased by 1.2 fold again the concentration was increased to 160 µg/ml then the percentage inhibition is increased by 0.4 fold, further the concentration was increased to 320 µg/ml then the percentage inhibition is increased by 1.3 fold again the concentration was increased to 640 µg/ml which resulted in the increase of percentage inhibition by 1.2 fold by 77.77%. All determinations were done in triplicate and the mean values were determined.
The IC50 value of Cassia fistula silver nanoparticles were found to be 206.5μg/ml. The IC50 value of acarbose was found to be 162.06 μg/ml.
The percentage of α-amylase inhibition of positive control Acarbose at lower and higher concentrations was found to be 23.17% and 77.77%.
The test Cassia fistula silver nanoparticles percentage α amylase inhibition at the lowest and highest concentration was found to be 20.09% and 75.56% respectively.
The α- Amylase inhibitory effects of positive control Acarbose are depicted in Table 6.
The α- Amylase inhibitory effects of Cassia fistula silver nanoparticles are depicted in Table 7.
The comparison of α- alpha-amylase inhibition of Acarbose vs. Cassia fistula silver nanoparticles is shown in Figure 15.
In vitro antidiabetic study Pterocarpus marsupium: α- amylase inhibition assay α-amylase is a key enzyme in carbohydrate metabolism. Inhibition of α-amylase is one of the strategies for treating diabetes. Amylase inhibitors are also known as starch blockers because they contain substances that prevent dietary starches from being absorbed by the body.
Amylase inhibitors with starchy meals will reduce the usual rise in blood sugar levels. The result suggests that Pterocarpus marsupium exhibits good α- amylase inhibition under in vitro conditions. The IC50 value of positive control was found to be 180 µg/ml and that of biosynthesized Pterocarpus marsupium silver nanoparticles were 700 µg/ml.
The percentage inhibition of Acarbose and Pterocarpus marsupium silver nanoparticles at lower and higher concentrations was found to be 41.44% and 84.09% for positive control Acarbose and 21.88% and 71.14% respectively
In-vitro drug release study
The in-vitro drug release study has been carried out using the dialysis bag diffusion membrane method. The time intervals (1h, 2h, 3h, 4h, 5h, 6h, and 24 h) were performed to find the amount of drug released.
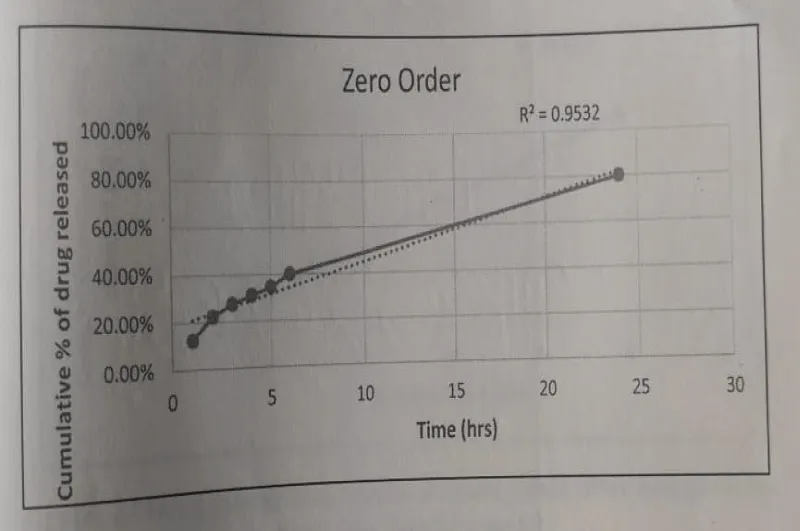
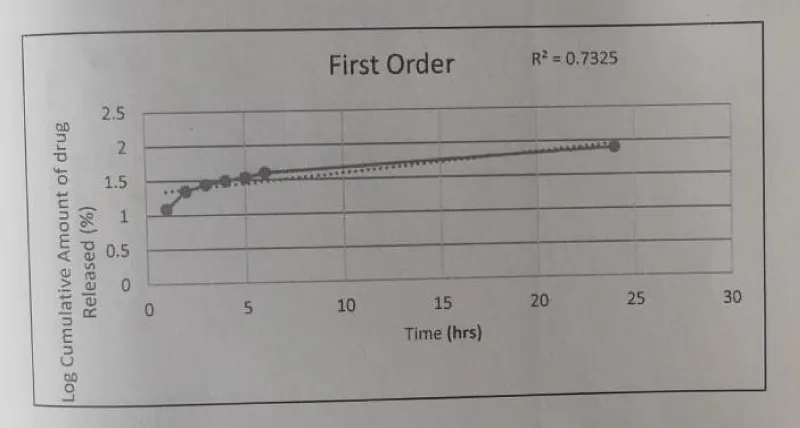
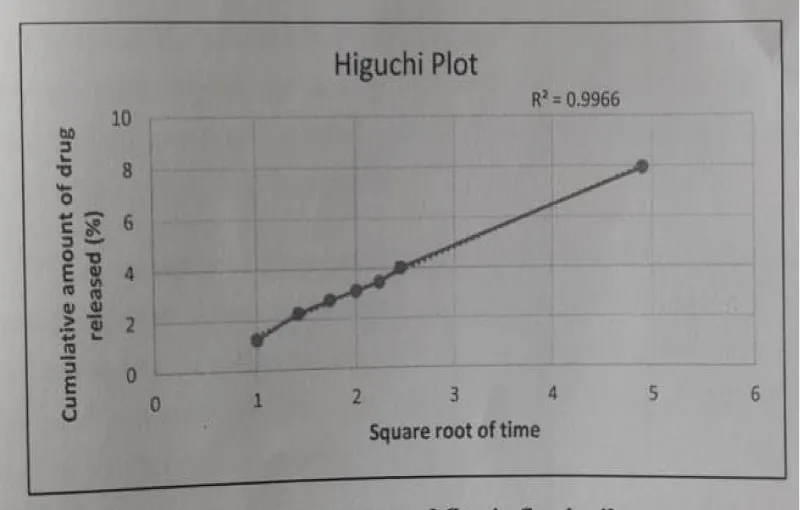
Cassia fistula silver nanoparticles in an in-vitro drug release study were done using the dialysis bag diffusion method. The cumulative percentage of drug released at 1 h was found to be 12.25%, at 2 h was found to be 22.25%, at 3 h was found to be 27.56%, at 4 h was found to be 31.11%, at 5 h was found to be 34.53%, at 6 h was found to be 40.02% and at 24 h was found to be 79.92% for 24 h.
Drug release data fitted to various kinetic models:
Zero order: The Zero Order kinetic model - Time vs. Cumulative percentage release was plotted and the R2 value was found to be 0.9532.
First order: The First Order Kinetic model -Time vs. log cumulative percentage was plotted and the R2 value was found to be 0.7325.
Higuchi’s: The Higuchi Model - Square root of time vs. Cumulative percentage release was plotted and the R2 value was found to be 0.9966.
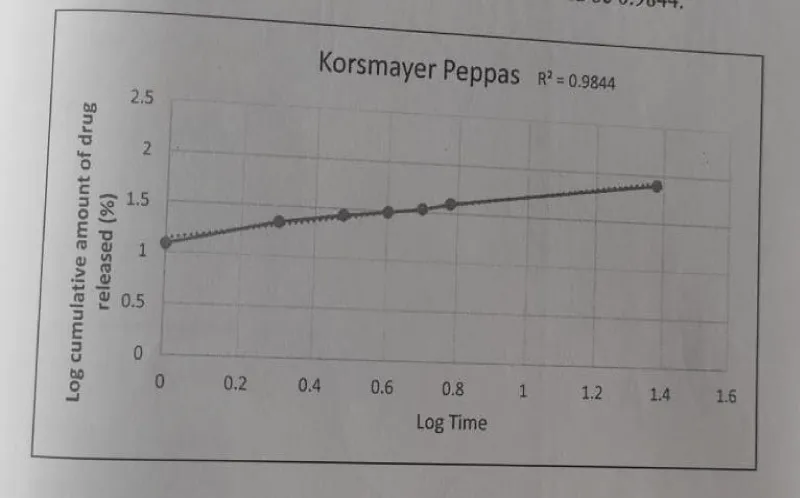
Korsmayer Peppas: The Korsmeyer Peppas model - Log time vs. log cumulative percentage were plotted and the R2 value was found to be 0.9844.
The Drug release data fitted to various kinetic models depicted in Figures 16-19.
Conclusion
The Cassia fistula silver nanoparticles formulated by a cost-effective and simple biosynthesis method with the association of plant Phytochemistry and nanotechnology will ensure a secure manner of curing diversified diseases in the near future. The results of the Cassia fistula nanoparticles namely visual examination, UV- -visible spectral analysis, FTIR spectroscopy, drug entrapment, determination of particle size, determination of Zeta Potential, FESEM analysis, - vitro anti-diabetic study and in vitro drug release and kinetic study were showing promising results which can be a lead to develop Cassia fistula as silver nanoparticles so as to enhance its anti-diabetic activity.
- Mohanraj V, Chen Y. Nanoparticles-a review. Trop J Pharm Res. 2006; 5(1):561-573.
- Sivakumar T.A modern review of silver nanoparticles mediated plant extracts and its potential bioapplications International Journal of Botany Studies 2021; 6: (3); 170-175. www.botanyjournals.com ISSN: 2455-541X; Impact Factor: RJIF 5.12.
- Mendieta1 VS, Rafael A, Nestor V. Nestor Green Synthesis of Noble Metal (Au, Ag, Pt) Nanoparticles, Assisted by Plant-Extract. Noble Metals.
- Mahomoodally MF, Sadeer N, Edoo M, Venugopala KN. The Potential Application of Novel Drug Delivery Systems for Phytopharmaceuticals and Natural Extracts - Current Status and Future Perspectives. Mini Rev Med Chem. 2021;21(18):2731-2746. doi: 10.2174/1389557520666200730160911. PMID: 32744974.
- Sandhiya V, Ubaidulla U. A review on herbal drug loaded into pharmaceutical carrier techniques and its evaluation process Future Journal of Pharmaceutical Sciences. 2020; 6: 51.
- Islam F, Wong SY, Xu Li, Arafat MT. Pectin and mucin cellulose-based superabsorbent hydrogel for controlled curcumin release springer.com. 2022; 29:5207-5222.
- Kushwah AS, Mittal R, Kumar M, Kaur G, Goel P, Sharma RK, Kabra A, Nainwal LM. Cardioprotective Activity of Cassia fistula L. Bark Extract in Isoproterenol-Induced Myocardial Infarction Rat Model. Evid Based Complement Alternat Med. 2022 Aug 23;2022:6874281. doi: 10.1155/2022/6874281. PMID: 36051494; PMCID: PMC9427257.
- Siddhuraju P, Mohan PS, Becker K. Studies on the antioxidant activity of Indian Laburnum (Cassia fistula L.): a preliminary assessment of crude extracts from stem, bark, leaves, flowers and fruit pulp. J Agric. Food Chem. 2002; 79:61-67.
- Kokate CK, Purohit AP, Gokhale SB. Pharmacognosy, edition; 45; 1&2: A1-6.
- Bartwal, Singh A, Ringwal S, Satish CS. Antimicrobial Activity of AgNPs Synthesized Via Green Approach by Using Flowers of Bistortamacrophylla herb of Tungnath Himalaya Region. J. Mount. Res.2021; 16(1): 161-167.
- Condurache MI, Petrovici AR, Simionescu N, Profire BS, Confederat LG, Bujor A, Miron A, Profire L. Simultaneous Determination of Glibenclamide and Silymarin Released from Chitosan Microparticles by HPLC-ESI-MS Technique: Method Development and Validation. Pharmaceutics. 2022 Oct 11;14(10):2164. doi: 10.3390/pharmaceutics14102164. PMID: 36297600; PMCID: PMC9611085.
- Sree V, Lola A, Sailaja K. Formulation of Mefenamic acid loaded polymeric nanoparticles by ionotropic gelation technique for the treatment of Rheumatoid arthritis. Int J of advance in Pharmaceutics. 2016;5(6):152-159.
- Viswanad V, Jilsha G. Nanosponge Loaded Hydrogel of Cephalexin for Topical Delivery. Int. J Pharm Sci Res.2015; 6(7): 2781-2789.
- Wang W, Gutu T, Gale DK, Jiao J, Rorrer GL, Chang CH. Self-assembly of nanostructured diatom microshells into patterned arrays assisted by polyelectrolyte multilayer deposition and inkjet printing. J Am Chem Soc. 2009 Apr 1;131(12):4178-9. doi: 10.1021/ja809079n. PMID: 19317494.
- Agung B, Efrilia T, Eko S. Antidiabetic and Antioxidant activity of jackfruit (Artocarpus heterophyllus) extract. J Med Biol Eng.2015; 4:318-23.
- Amiri B, Ebrahimi-Far M, Saffari Z, Akbarzadeh A, Soleimani E, Chiani M. Preparation, Characterization and Cytotoxicity of Silibinin- Containing Nanoniosomes in T47D Human Breast Carcinoma Cells. Asian Pac J Cancer Prev. 2016;17(8):3835-8. PMID: 27644625.
- Salome CA, Godswill OC, Ikechukwu OI. Kinetics and Mechanism of Drug Release from Swellable and Non Swellable Matrices: Review. Research. J Pharmaceutical, Biological and Chemical Sciences. 2013; 2(2):97-103.
- Crouch HS. Principles instrumental analysis, edition: 6: 459-461.
- Pandit C, Roy A, Ghotekar S, Khusro A, Islam MN, Emran TB, Lam SE, Khandaker MU, Bradley DA. Biological agents for synthesis of nanoparticles and their applications. Journal of King Saud University-Science. 2022; 34(3):101869.
- Jangir RN, Jain GC. Evaluation of antidiabetic activity of hydroalcoholic extract of Cassia fistula Linn. pod in streptozotocin-induced diabetic rats. Pharmacognosy Journal. 2017; 9(5).
Article Alerts
Subscribe to our articles alerts and stay tuned.
 This work is licensed under a Creative Commons Attribution 4.0 International License.


 Save to Mendeley
